

How to Successfully Implement Sugester. #8 Analytics and Reporting in Sugester
This is the final article in our series for new users on how to implement Sugester in your company quickly and effortlessly. We have already covered activating the most important features, data security, automation, and customizing the system to your company’s needs.
To close out the series, we tackle an equally important topic that should interest not only new users: reporting and data analysis in Sugester.
We will not describe every available report — there are quite a few. Instead, we want to show you how to analyze sales data in Sugester, track the results of email campaigns, and where to find customer service statistics.
Did you know that not all data in Sugester needs to be analyzed through reports?
Did you know that sometimes a simple search and a few filters are all you need to carry out effective analysis and draw conclusions?
And did you know that in Sugester you can create your own custom reports?
If you answered "no" to even one of those questions — don’t worry. Everything will become clear in just a moment.
First, check what reports, statistics, and analyses you will find in this article:
Why use reports in your CRM?
Systems like CRM are often still used mainly as a place to store customer data. You may be surprised how much you can learn — not only about your customers, but also about your employees and company activities — by using the built-in reporting and data analysis tools.
With the reports available in your CRM system, you do not need to build complex spreadsheets and enter data manually. You also do not need additional applications that require logging in every time you need to check your statistics. In a CRM, all the information you need to monitor, analyze, and optimize your activities is right at hand.
Key advantages of tracking statistics in a CRM:
- Statistics are generated automatically.
- Data updates in real time — if you are checking sales results and another sale closes, just refresh the page to see it appear in the table.
- You can run analyses on any device, from anywhere.
- No additional applications or Excel files are needed.
Below we have prepared some suggestions on how to report and analyze data in Sugester.
Number of closed and resolved tickets
Every support team operates differently. However, it is worth monitoring your team’s work to understand its performance, check whether the team is overloaded, and identify which aspects of support can be improved.
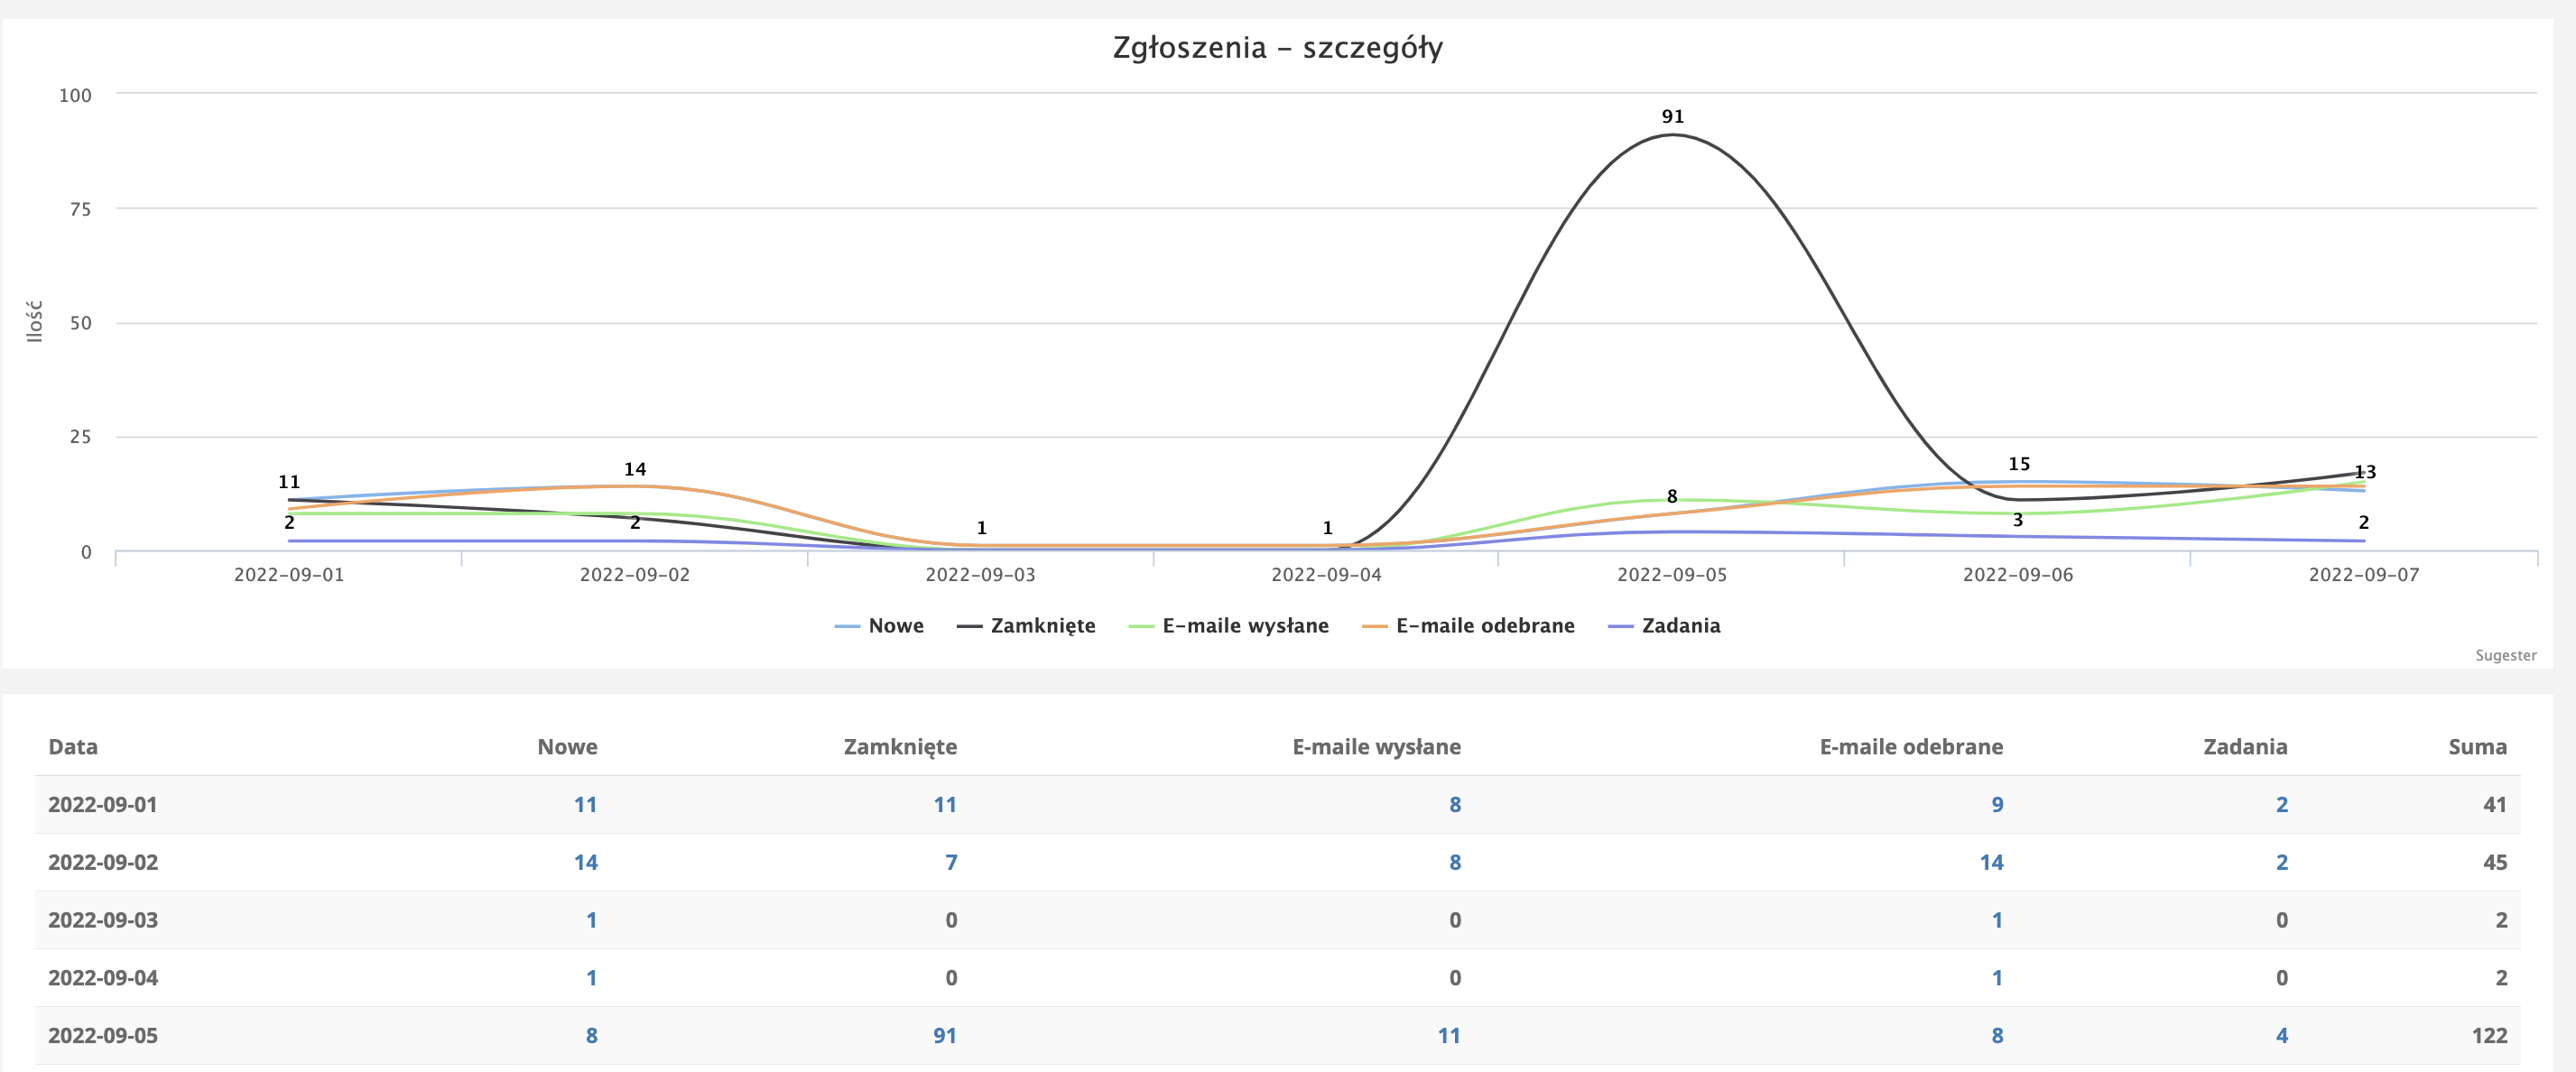
If you want to know how many emails came into your support department on a given day, how many messages your staff replied to, how many tickets were resolved, and how many tasks were created, use the "Tickets — details" report in Sugester.
The data is displayed both graphically (as a chart) and as a table. You can analyze it broken down by individual departments and employees, with a custom date range.
This way you can, for example, observe which day of the week or time of day sees the highest volume of inquiries and think about how to better manage that load.
You can also check which customer has the most unresolved tickets on a given day — simply enter the customer’s name in the relevant field within the same report.
Report results can be exported to an XLS file at any time.
![]()
Ticket resolution time and first response time
To understand how long it takes to close a single ticket, analyze the data available in the "Users" report in Sugester. Information visible there — such as the ticket submission date, first response date, and ticket closure date — will allow you to assess employee performance and analyze which tickets require more time and which can be handled immediately.
The report also lets you verify which responses require input from another employee or team, and how that extends the lifecycle of a single ticket. The report can be sorted by date, individual employees, or customers, and results can be downloaded as XLS or PDF files.
Report on the most common topics in customer tickets
If you want to identify the most common topics customers raise with your support team, use email tagging. By adding a tag to each message describing the ticket topic — e.g. "invoice issuance", "account fee", "application error" — you will be able to check at the end of the month, using the "Post tags" report, which topics are the most frequent. With this information you can consider how to reduce the number of similar inquiries (a company knowledge base is a great solution) or identify which customer-reported bugs should now be your top priority.

Email campaign statistics
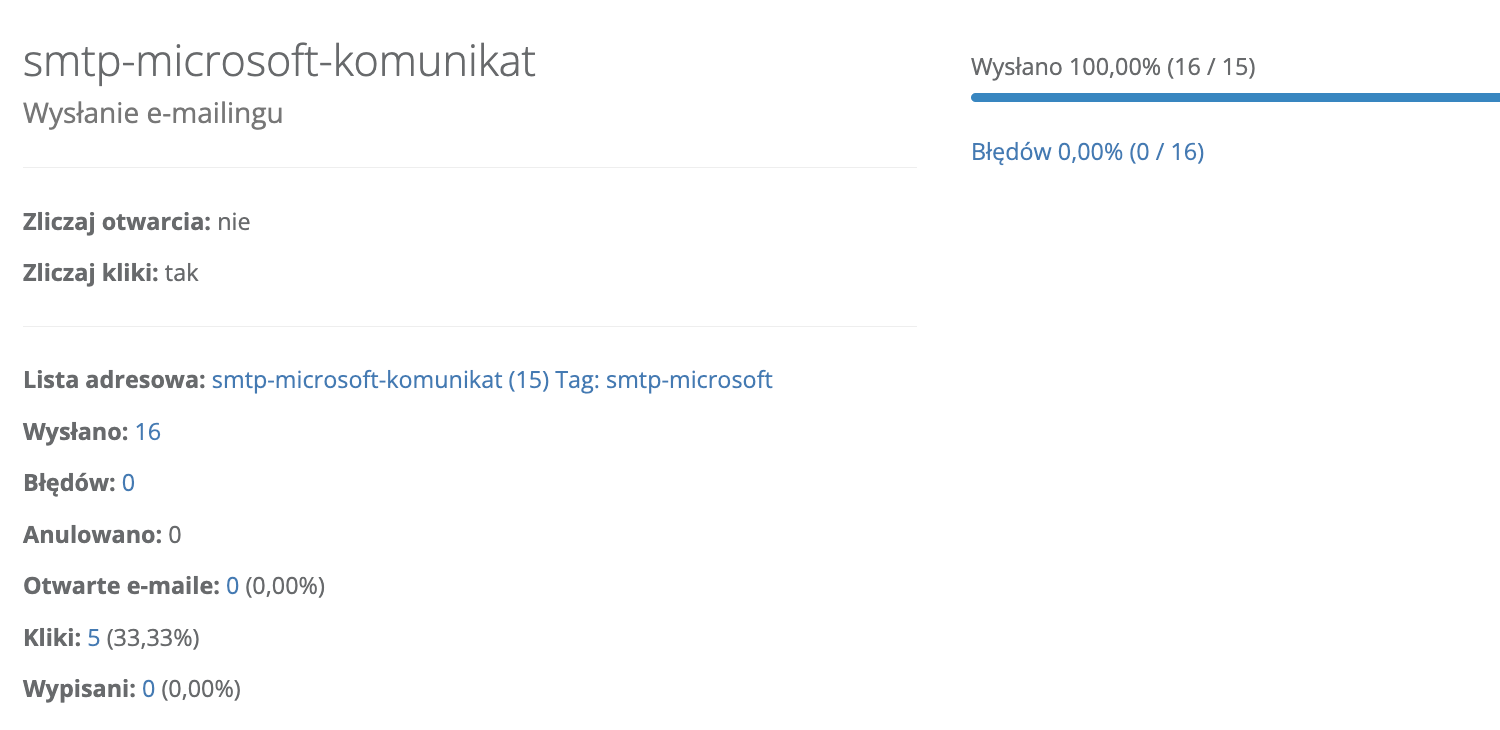
The Email marketing module in Sugester not only lets you prepare and send email campaigns, but also track their results.
Through the statistics displayed for each mailing, you can verify what percentage of emails reached the recipients. You can also check how many people clicked a link in your message and how many recipients unsubscribed from the mailing list. If for some reason an email did not reach the recipient, you can find out why by clicking "errors" — you will see a list of email addresses from the campaign with a description of the error that prevented delivery.
With this data you can plan future campaigns more effectively and more easily define your target audience. To track campaign results, simply open the relevant campaign from the email campaigns list.
Sales conversion rate
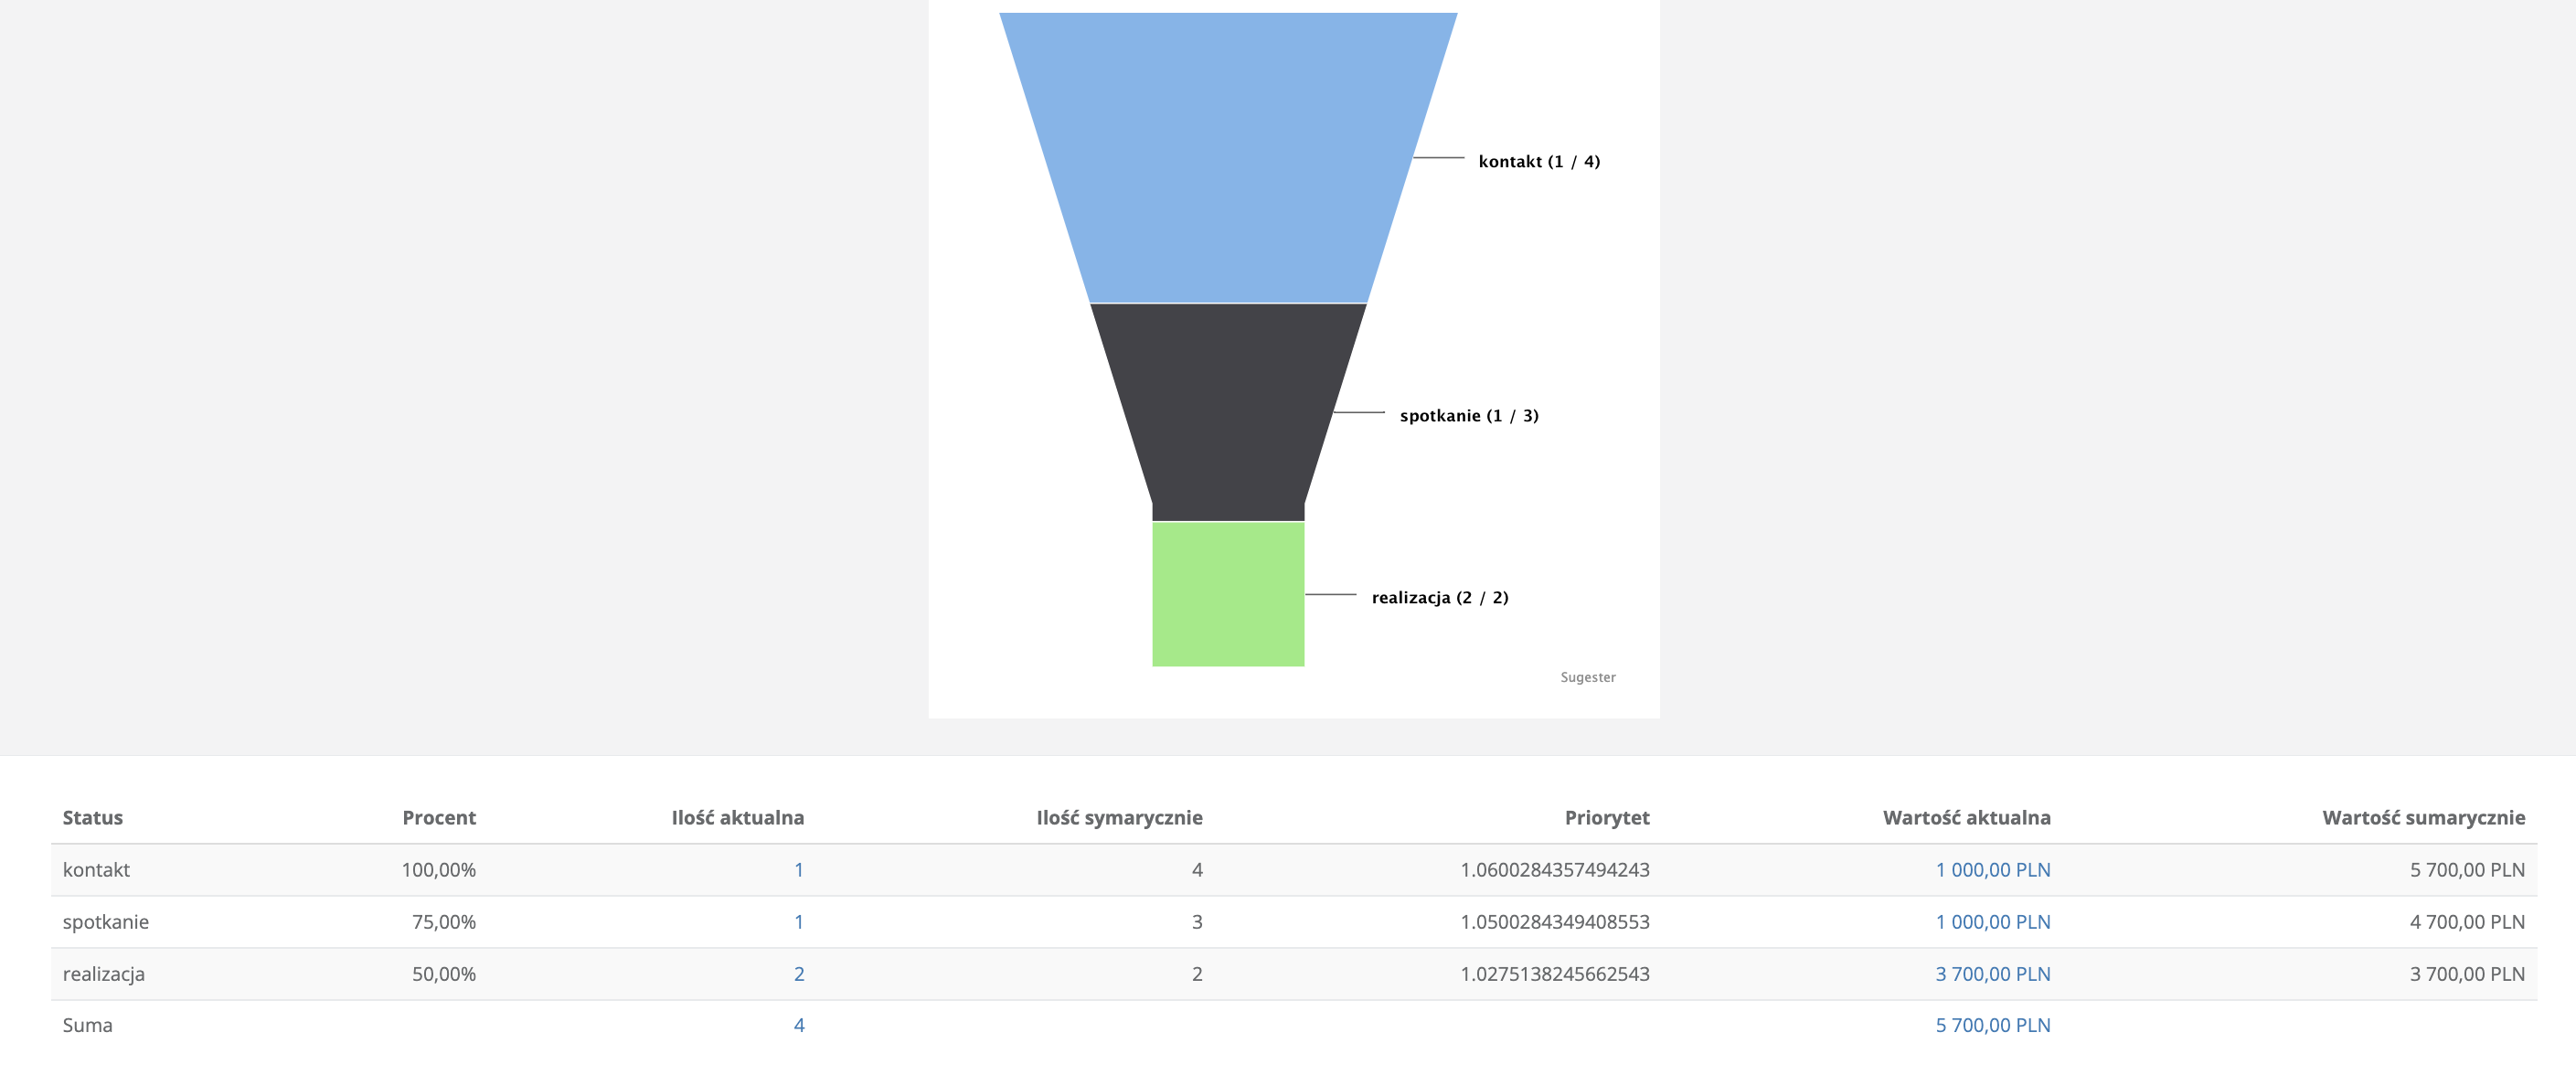
One of the reports that visualizes the sales process, its individual stages, and how many sales opportunities resulted in a closed deal is the sales funnel. In Sugester, the sales funnel is generated based on deal statuses, which is very important — without properly configured statuses (in the right order), the funnel will not be particularly useful.
A well-configured funnel will help you identify customers who are genuinely interested in your offer and allow you to engage them appropriately at each stage of the sales process.
Using funnels, you can track the sales conversion rate broken down into groups such as the lead source, online sales, in-person sales, etc. These groups are defined in Sugester through the pipeline feature.

Popularity data for sold services/products
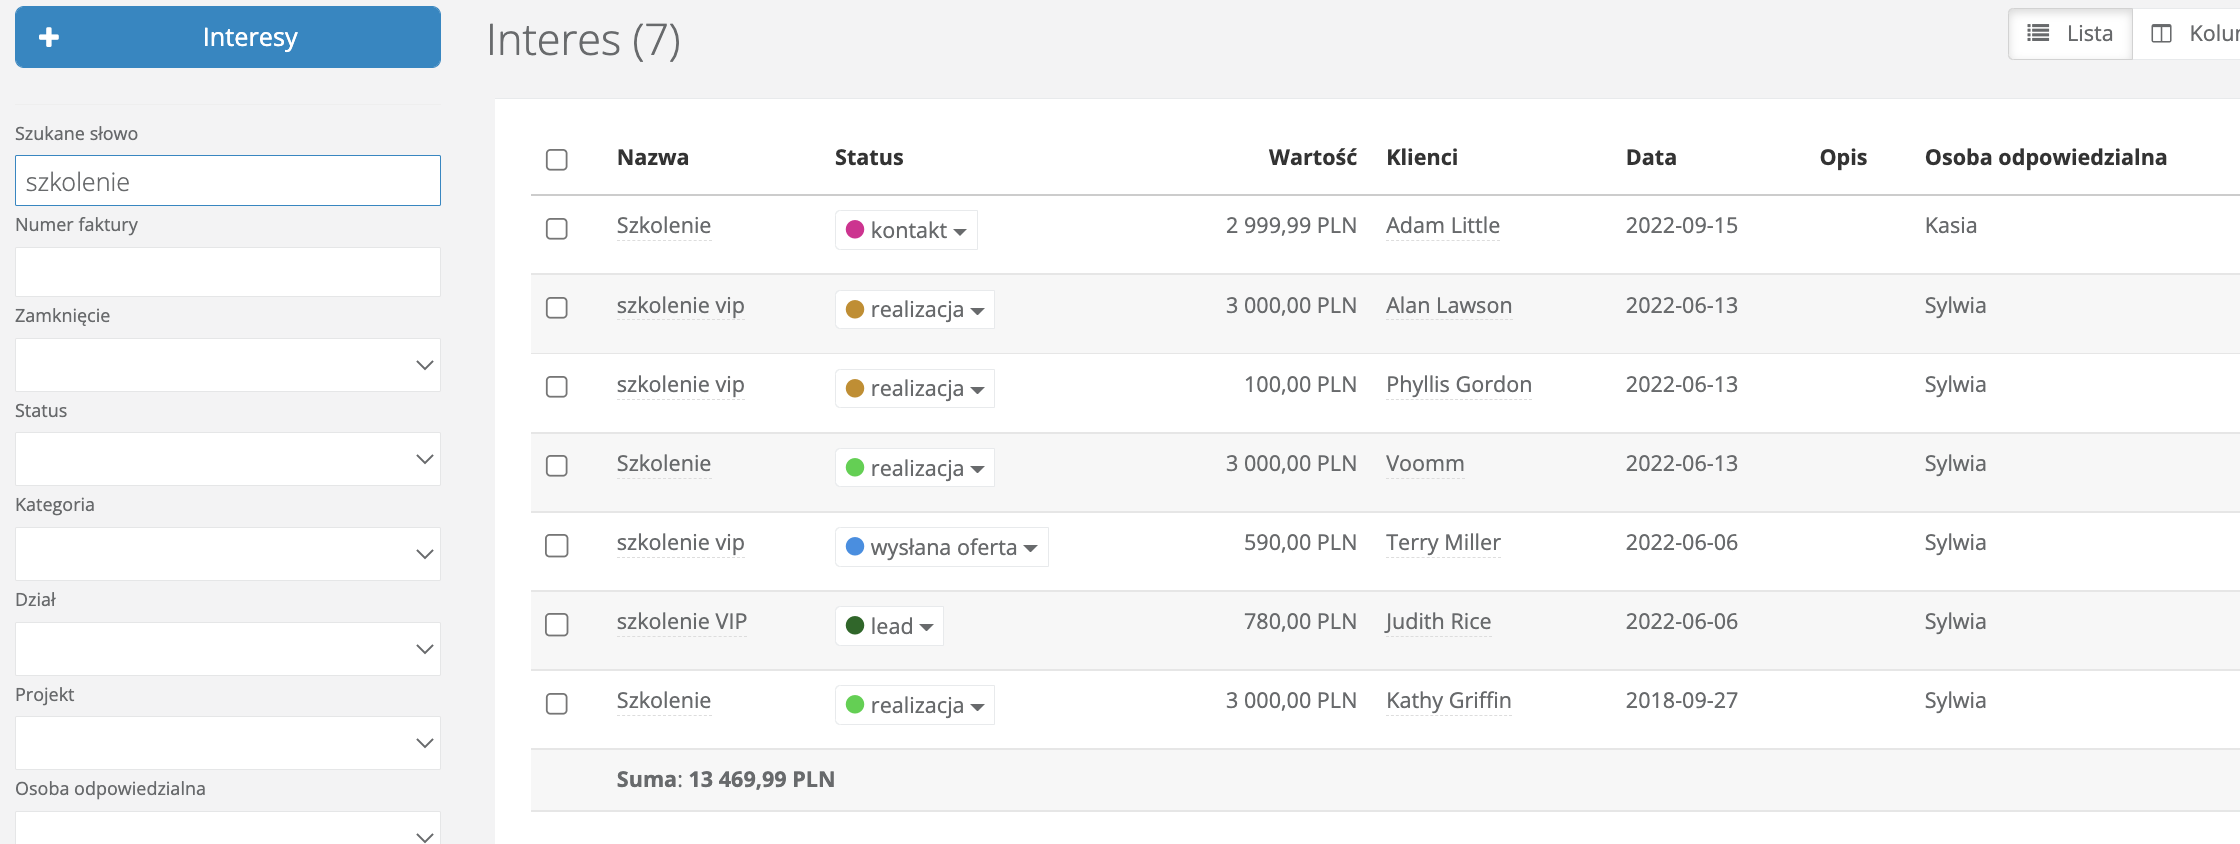
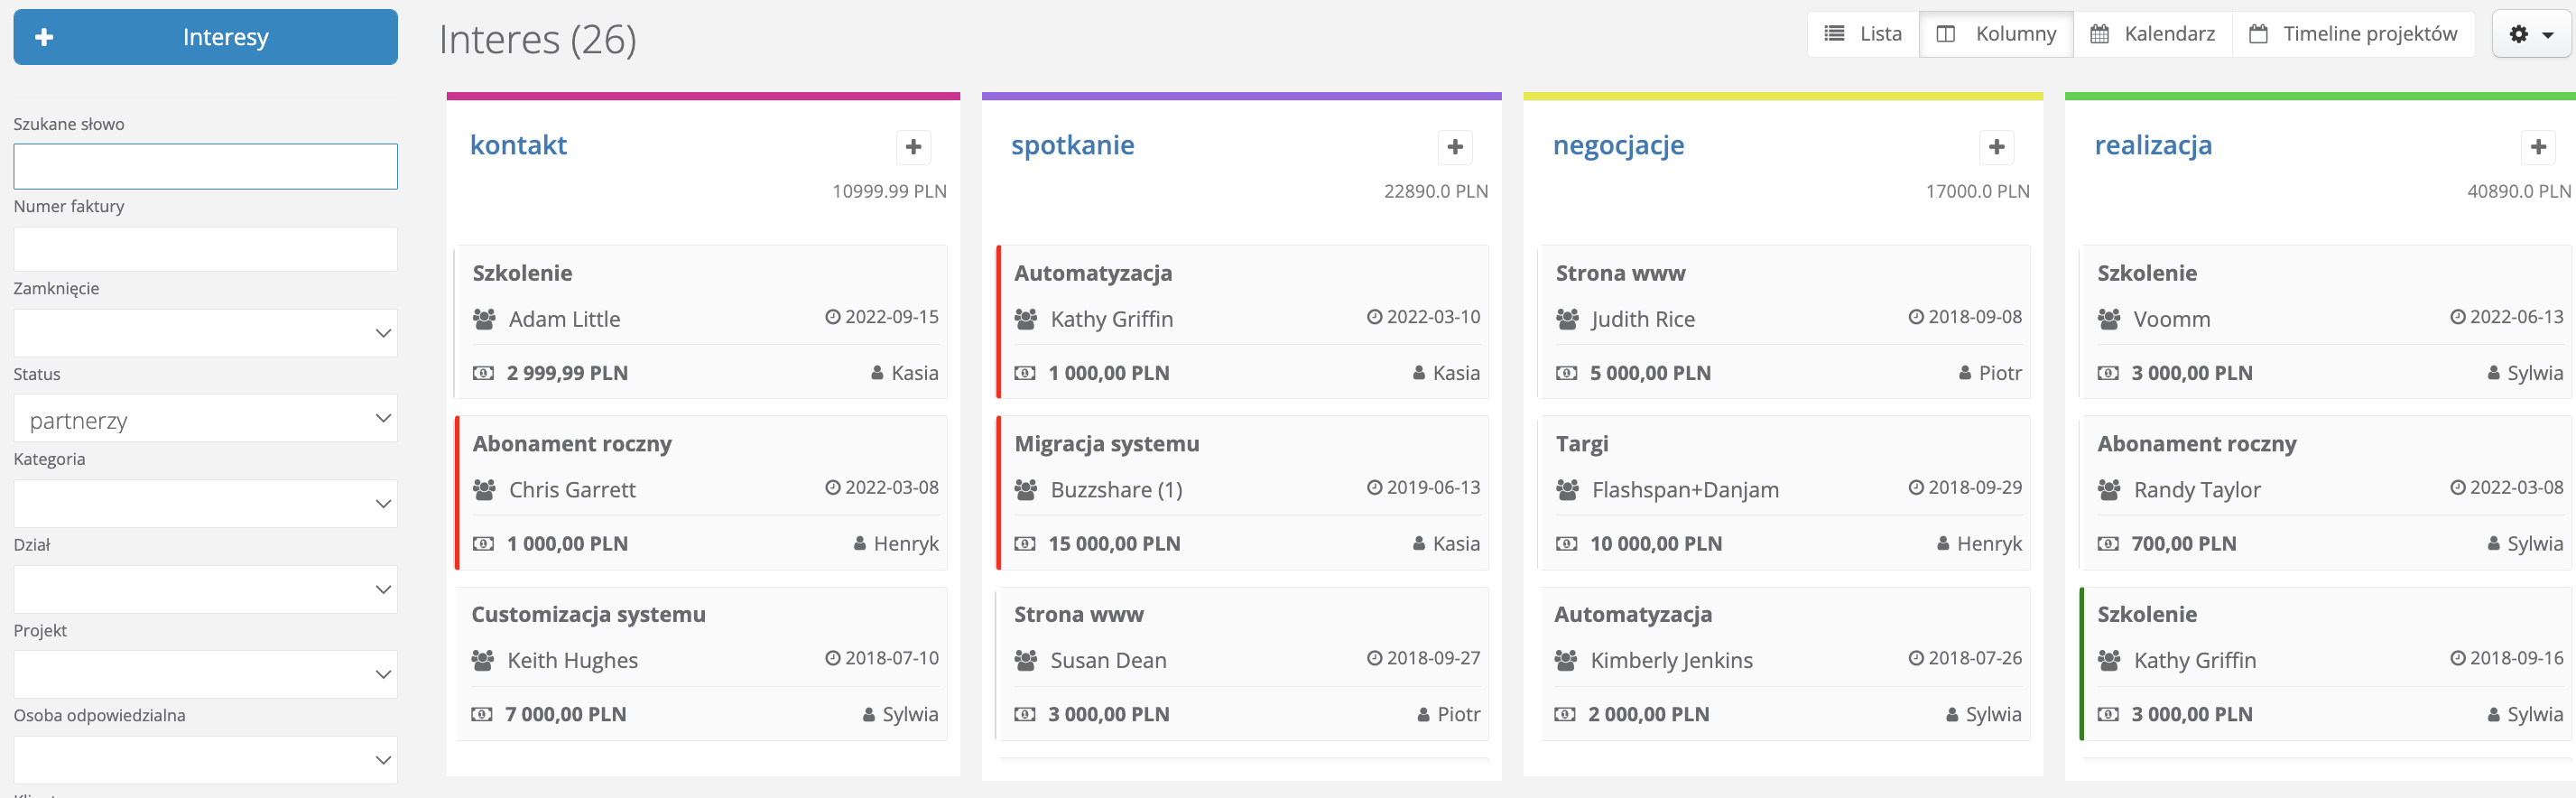
If you want to find out which product is purchased most frequently, simply type the product name into the search bar on the deals list. You will see a list of deals containing only that product along with the total revenue from its sales. No complex reports are needed for this type of data monitoring.
Sales forecasting
In the deals section you can filter sales opportunities by status, i.e. by sales stages. This allows you to monitor projected revenue and plan marketing strategies. Simply select a specific sales stage in the "Status" field on the deals list. If you have pipelines configured in Sugester, you can also select the relevant pipeline, which shows the monetary and count values for each stage.
Closed and lost deals data
Using the deals list in Sugester and its available filters, you can quickly verify the number of won deals (closed with a purchase) and lost deals (those that ended with the customer dropping out). Simply select "won" in the "closing" field and set a date range to analyze the data. You can also divide your salespeople into groups or departments and monitor which team generates which results.
On the same list you can also verify the reasons for lost deals — simply add a custom field in deals, e.g. "Reason for drop-off".
Work time report
You can verify your team’s productivity using the timesheet report. The data it contains lets you see how much time an employee spent resolving a case — whether it relates to handling a single ticket, a phase of a given project, or the time spent on a specific customer. A key element of the work time report is the "Log time" function, which activates a timer. This gives you precise, minute-by-minute data on how much time an employee spent on a given task.
The timesheet in Sugester not only helps you monitor the progress of work within your company, but also greatly simplifies the preparation of weekly/monthly work reports and employee time settlements.
Customer satisfaction report
This data is handled by the "Communication rating" report in Sugester. Every customer who contacts your company by email has the opportunity to leave a rating or express an opinion about the level of service. Each email contains three icons representing the emotions the customer experiences after interacting with your support team. You can review the results in a convenient table, divided into columns showing the number of positive, negative, and neutral ratings, broken down by user.
Consultant productivity
In sales, results are what matter — specifically the final stage of the process: closing the deal. Using the appropriate analysis in Sugester, you can check which of your salespeople brings the most profit to the company. You can do this by sorting the data table in the Deals section. A simple combination of filters — user, date range, status — is all you need to quickly check each employee’s sales performance without generating complex reports.
You can also verify which employee sends the most emails, generates the most tasks, and handles the most calls, thanks to the "User activity" report. The report lets you display results for an individual employee or compare them against the performance of an entire department, group, or selected individuals.

Creating custom reports
Sometimes the default reports available in Sugester may not fully meet your company’s needs. That is why we give you the ability to create your own custom sales reports based on data from customers and deals.
Building a custom report uses HTML, CSS, and the variables available for that report. If you are thinking this sounds too technical because you are not a developer — think again. A list of available variables you can use in the report is right there in the report creation form, in the help link next to the Name field. Just think about what data you want to monitor and use the variables corresponding to specific fields, e.g. from the deals list. You will get a clear table with selected data, generated fresh every time you open the report.

Reporting and data analysis are an important part of working with a CRM because they help visualize progress, identify areas in need of improvement, and make realistic plans for the future. Reports do not have to be boring, and preparing them does not have to be tedious or time-consuming. You just need to know which areas you want to monitor and where to find them in Sugester.
After reading this article, we hope navigating Sugester’s reports will be much easier for you.